LTM vs NTM Valuation Multiples: The Complete Professional Guide for 2026
Introduction
LTM vs NTM valuation multiples represent the two fundamental timeframes that drive every meaningful business valuation decision. Whether you are closing a Series B round, evaluating an acquisition target, or preparing an IPO, understanding when and how to apply these metrics can mean the difference between capturing true market value and leaving millions on the table.
At Transaction Capital LLC, our ABV®, ASA, and CVA® certified valuation experts have completed over 2,500 valuations across 35+ industries. In our experience, the most common valuation mistakes stem not from faulty methodology, but from selecting the wrong timeframe for the analysis. This guide walks you through everything you need to know about LTM and NTM multiples—from basic calculations to advanced applications in M&A, private equity, and regulatory compliance contexts.
LTM (Last Twelve Months) multiples anchor your valuation in verified historical performance, while NTM (Next Twelve Months) multiples capture projected growth and future earnings potential. Professional valuators use both approaches together to establish defensible valuation ranges rather than relying on single-point estimates.
What Are Valuation Multiples and Why Do They Matter?
Valuation multiples express the relationship between a company’s total value and its financial performance indicators. Think of them as the universal language of corporate finance—a standardized way to compare companies across different industries, sizes, and growth stages without getting lost in the weeds of absolute dollar amounts.
The Standard Formula:
Valuation Multiple = Company Value Measure ÷ Financial Performance Driver
Value Measures Include:
- Enterprise Value (EV): The total worth of a company to all stakeholders, including both equity holders and debt holders. Calculated as market capitalization plus total debt minus cash and equivalents.
- Equity Value (Market Cap): The value belonging exclusively to common shareholders, calculated as share price multiplied by diluted shares outstanding.
Financial Performance Drivers Include:
- Revenue, EBITDA, EBIT for Enterprise Value calculations
- Net Income, Earnings Per Share (EPS) for Equity Value calculations
Matching Rule: Enterprise value must always pair with pre-financing metrics (like EBITDA), while equity value pairs with post-financing metrics (like net income). This fundamental principle prevents valuation of errors that could cost millions in M&A transactions. Mixing these incorrectly—such as dividing EV by net income—produces meaningless ratios that will fail to audit scrutiny.
How Do LTM and NTM Valuation Approaches Differ?
The distinction between LTM and NTM multiples comes down to one critical factor: the timing of the financial data used in the denominator.
Last Twelve Months (LTM) Multiples
LTM valuation multiples utilize actual, audited financial data from the most recent twelve-month period. Also known as trailing twelve months (TTM) multiples, these calculations provide a factual foundation based on verified performance that has already occurred.
Key characteristics of LTM multiples:
- Based on actual, audited financial results
- Independently verifiable through SEC filings (10-K, 10-Q) or audited statements
- More reliable and less subjective than forward projections
- Preferred by conservative investors, lenders, and value-oriented buyers
Next Twelve Months (NTM) Multiples
NTM multiples incorporate projected financial performance for the upcoming twelve months. These forward-looking multiples capture anticipated growth, market expansion, and operational improvements that LTM data cannot reflect.
Key characteristics of NTM multiples:
- Based on projected financial performance
- Derived from analyst consensus estimates or management guidance
- Captures growth potential and strategic initiatives
- Preferred by growth investors, venture capital, and strategic acquirers
Important: Both approaches use identical formulas—the distinction lies entirely in whether the denominator reflects historical actuals or future projections. This timing difference significantly impacts valuation conclusions, especially for high-growth companies or businesses in transition.
Need Expert Guidance on Valuation Multiples?
Schedule a free 15-minute consultation with our certified appraisers to discuss your specific valuation needs.
What Is the Step-by-Step Process for Calculating LTM Financial Metrics?
Calculating accurate LTM metrics requires the “stub period” adjustment method to ensure exactly twelve months of data. This technique is standard practice in investment banking and professional valuation.
LTM Calculation Formula
LTM Metric = Latest Annual Result + Current Year-to-Date − Prior Year Same Period
Practical Example
Consider a company with the following revenue figures:
- 2025 Full Year Revenue: $45 million
- Q1 2026 YTD Revenue: $13.2 million
- Q1 2025 Revenue: $10.8 million
LTM Revenue = $45M + $13.2M − $10.8M = $47.4M
This calculation captures the most recent twelve months of actual performance (Q2 2025 through Q1 2026), giving you a more current picture than simply using the last fiscal year alone.
1. Essential Data Sources
- Public Companies: SEC filings including 10-K annual reports and 10-Q quarterly reports, available through EDGAR
- Private Companies: Audited financial statements plus monthly or quarterly management reports
2. Required Normalizing Adjustments
Based on our experience completing thousands of valuations, these adjustments are critical for accurate LTM calculations:
- Eliminate one-time events (legal settlements, asset sales, restructuring costs)
- Include pro forma adjustments for recent acquisitions or divestitures
- Account for seasonal variations and normalize unusual items
- Adjust for changes in accounting policies or methods
- Remove non-operating income or expenses
Our startup valuation services at Transaction Capital LLC always includes these normalizing adjustments to ensure LTM metrics reflect true operational performance rather than distorted figures.
How Do You Project Accurate NTM Financial Metrics?
NTM calculations require building reliable forward-looking financial projections using multiple data sources and rigorous validation techniques.
Primary Data Sources for NTM Projections
- Management guidance and strategic plans
- Wall Street analyst consensus estimates (for public companies via Bloomberg, FactSet, Capital IQ)
- Industry growth rates and market research from sources like IBISWorld and Statista
- Customer pipeline data and contract renewal information
- Historical achievement rates (how well has management hit prior projections?)
NTM Projection Process
- Establish Current Run Rate: Use most recent quarterly results annualized as your baseline
- Apply Growth Assumptions: Incorporate market trends, sales pipeline strength, and capacity constraints
- Adjust for Business Cycles: Account for seasonality patterns and known contract renewals
- Calculate Bottom-Line Impact: Project through to EBITDA, operating income, and net earnings
- Validate Against Benchmarks: Cross-check against industry averages and historical achievement rates
Risk Management Note: NTM numbers carry inherent forecast risk and potential management optimism. Always validate projections against historical achievement rates and industry benchmarks. In our practice, we’ve found that management projections often need to be discounted by 10-20% for realistic valuations.
Professional Standards Compliance: Our NTM calculations adhere to USPAP (Uniform Standards of Professional Appraisal Practice), SSVS (Statements on Standards for Valuation Services), and NACVA compliance standards, while following IRS Revenue Ruling 59-60 guidelines.
What Is Calendarization and When Do You Need It?
Calendarization is a critical technique that many competitors overlook. When comparing companies with different fiscal year-ends, you must align their financial periods to make apples-to-apples comparisons.
The Problem: Company A has a fiscal year ending December 31, while Company B’s fiscal year ends June 30. Comparing their “latest annual” figures means comparing different time periods—making your comparable company analysis meaningless.
The Solution: Use LTM figures for all companies in your comparable set. Since LTM calculations always capture the most recent twelve months regardless of fiscal year-end, they naturally align all companies to the same time.
For NTM calculations, you can use weighted approaches. For example, if you’re in April 2026 and need NTM revenue through April 2027, you might use: NTM Revenue = (8/12) × FY 2026 Estimate + (4/12) × FY 2027 Estimate. This assumes relatively even revenue distribution—for highly seasonal businesses, use quarterly forecasts instead.
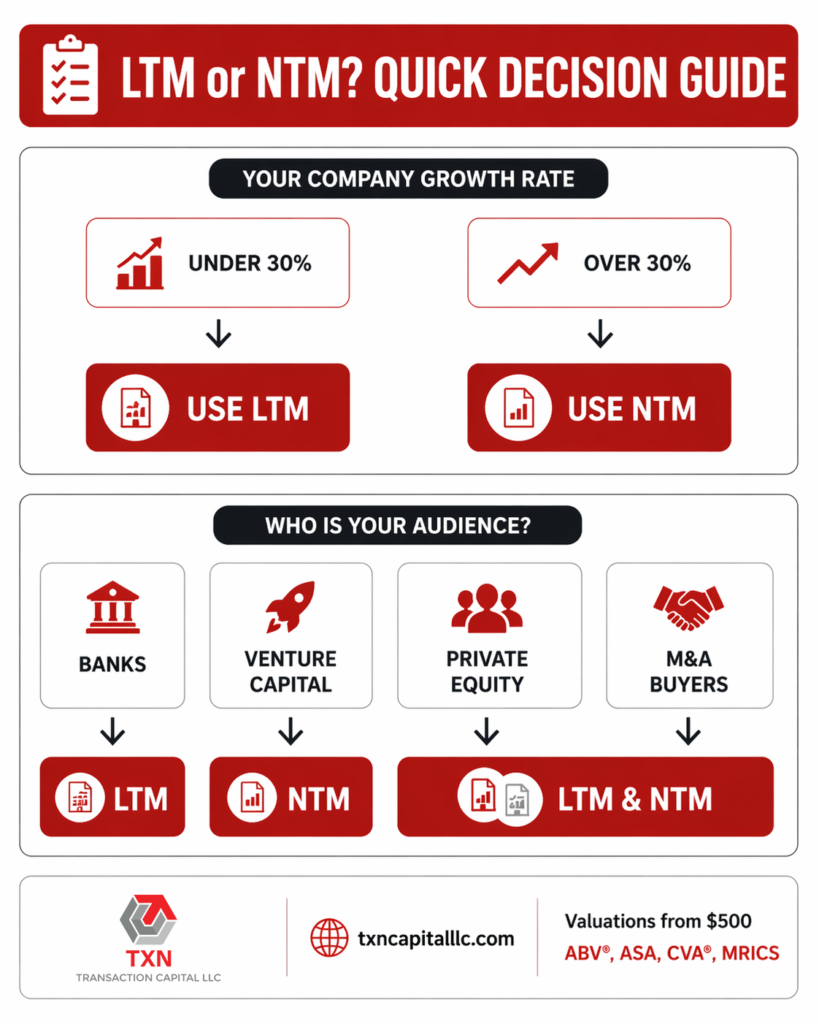
When Should You Use LTM vs NTM Valuation Multiples?
The choice between LTM and NTM multiples depends on company characteristics, transaction purpose, and the preferences of your target audience.
|
Business Scenario |
Recommended Approach |
Primary Reasoning |
|
Mature, stable companies |
LTM emphasis |
Reliable historical track record; past performance is good proxy for future |
|
High-growth startups (50%+ growth) |
NTM emphasis |
Captures scaling momentum; LTM significantly understates value |
|
Seasonal businesses |
NTM preferred |
Avoids timing distortions; ensures full cycle captured |
|
M&A transaction analysis |
Both approaches |
LTM for current state; NTM for deal ROI and synergy valuation |
|
Public market comparisons |
Both approaches |
Market primarily uses forward multiples; LTM provides grounding |
|
409A valuations |
LTM primary |
IRS prefers verifiable data; NTM used for growth companies only |
|
Leveraged buyouts (LBOs) |
LTM EBITDA |
Debt capacity based on proven cash flow; lenders require LTM |
|
Venture capital investments |
NTM primary |
Growth potential is primary value driver; limited historical data |
Best Practice: Professional valuators use both LTM and NTM multiples to establish valuation ranges rather than relying on single-point estimates. This approach provides greater accuracy and defensibility during investor presentations, board meetings, or audit reviews.
Get Your Professional Valuation Starting at $500.
Transaction Capital’s ABV® and ASA certified professionals deliver audit-ready reports in 2-5 business days.
How Do Different Investor Types Approach LTM vs NTM Multiples?
Understanding investor preferences helps you frame your valuation appropriately for your audience.
1. Investment Banks (M&A Advisory)
In M&A transactions involving mature companies, bankers rely heavily on LTM because it reflects stable, proven results. For high-growth businesses, bankers lean toward NTM because forward-looking earnings better reflect likely deal pricing. Most pitch books present to establish a valuation range.
2. Private Equity Firms
PE firms take a balanced approach. They review LTM EBITDA to understand current debt capacity and performance but rely on NTM projections to estimate returns over their investment horizon (typically 3-7 years). They also stress-test management forecasts against macroeconomic scenarios and apply haircuts to overly optimistic projections.
3. Venture Capital Firms
VCs rely almost entirely on NTM and forward multiples. Early-stage startups often have limited historical performance, and what matters most is growth potential. Revenue multiples (EV/NTM Revenue) dominate VC discussions rather than EBITDA multiples, since many portfolio companies aren’t yet profitable.
4. Commercial Lenders
Banks and credit facilities focus almost exclusively on LTM metrics. Debt covenants are typically based on LTM EBITDA, and loan-to-value calculations use historical performance. Lenders want verifiable data that demonstrates actual debt service capacity.
What Does a Real-World LTM vs NTM Comparison Look Like?
Sample Technology Company Analysis
Consider a mid-stage SaaS company with the following profile:
- Current Share Price: $85
- Outstanding Shares: 50 million (diluted)
- Market Capitalization: $4.25 billion
LTM Performance:
- LTM Net Income: $340 million
- LTM P/E Ratio: 12.5x ($4.25B ÷ $340M)
NTM Projections:
- NTM Net Income: $465 million (37% growth expected)
- NTM P/E Ratio: 9.1x ($4.25B ÷ $465M)
Analysis: The stock appears reasonably valued on historical earnings (12.5x) but attractively priced relative to projected growth (9.1x forward). This dual perspective helps investors understand both current valuation levels and future potential returns. A growth investor might find the 9.1x NTM P/E compelling, while a value investor might focus on whether the 37% growth projection is achievable.
How Do SaaS Companies Handle ARR vs NTM Revenue Calculations?
Software-as-a-Service companies require specialized treatment due to their subscription-based revenue models and typically high growth rates. In our experience valuing hundreds of SaaS businesses, we’ve found that using the wrong metric can swing valuations by 30-50%.
ARR (Annual Recurring Revenue) vs NTM Revenue
- ARR: A snapshot of current Monthly Recurring Revenue (MRR) multiplied by 12. It represents the annualized value of your current subscription base if nothing changes.
- NTM Revenue: A forward projection that incorporates expected churn, expansion revenue, and new customer acquisition over the next twelve months.
Critical SaaS-Specific Adjustments
- Net Revenue Retention (NRR): Typically, 100-130% for healthy SaaS businesses. NRR above 100% means existing customers are spending more time.
- Gross Revenue Retention (GRR): Measures customer stickiness, typically 85-95% for enterprise SaaS.
- Cohort-Level Expansion: Upselling and cross-selling success rates by customer vintage.
- Seasonal Factors: Enterprise software often sees Q4 budget flush and renewal cycles.
Our business valuation services include specialized SaaS calculations that properly weight these factors to produce defensible, audit-ready valuations that investors and acquirers will accept.
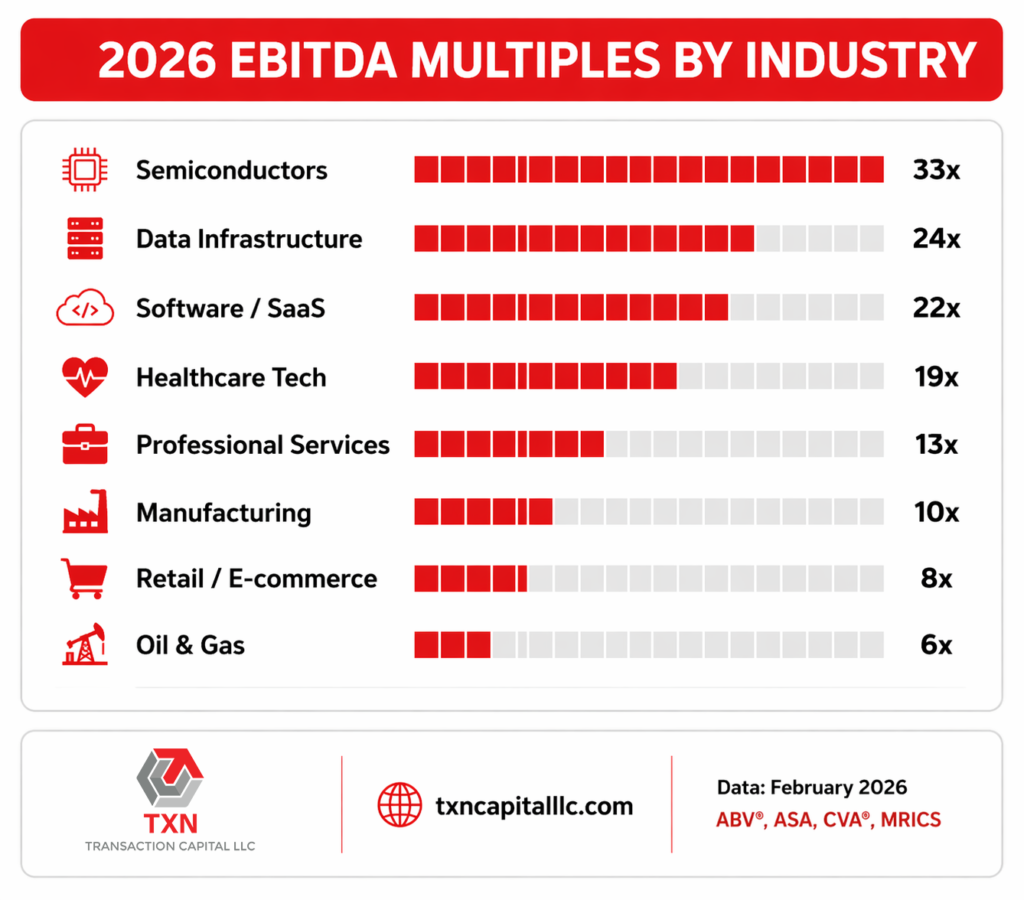
What Are Current Industry EBITDA Multiples for 2026?
Understanding industry benchmarks provides essential context for your valuation analysis. These multiples represent median EV/EBITDA ratios as of February 2026:
|
Industry |
Median EV/EBITDA |
Typical Range |
|
Software / SaaS |
22.4x |
15x – 46x |
|
Semiconductor Equipment |
33.2x |
25x – 45x |
|
Healthcare Technology |
18.5x |
12x – 28x |
|
Professional Services |
12.8x |
8x – 18x |
|
Manufacturing |
9.5x |
6x – 14x |
|
Retail / E-commerce |
8.2x |
5x – 12x |
|
Oil & Gas E&P |
5.9x |
4x – 8x |
Note: These are public company multiples. Private company valuations typically apply a 15-30% discount for lack of marketability (DLOM) and may also apply control premiums or discounts depending on the ownership stake being valued.
What Are the Key Advantages and Limitations of Each Approach?
|
Aspect |
LTM Multiples |
NTM Multiples |
|
Strengths |
|
|
|
Limitations |
|
|
How Do Growth-Adjusted Multiples Provide Additional Insight?
The Enterprise Revenue Growth (ERG) ratio combines valuation multiples with growth rates to assess relative value across companies with different growth profiles.
ERG = (EV ÷ NTM Revenue) ÷ Revenue Growth Rate %
Practical Example
- EV/Revenue Multiple: 6.0x
- Annual Revenue Growth: 20%
- ERG Ratio: 0.30 (6.0 ÷ 20)
Interpretation Guidelines
- ERG around 0.30: Close to median for SaaS companies; generally fair value
- ERG below 0.25: Potentially undervalued relative to growth
- ERG above 0.40: Potentially overvalued relative to growth expectations
Industry Rule of Thumb: When EV/Revenue approximately equals 1/3 of the growth rate (ERG ≈ 0.33), the valuation often represents fair market value for most technology sectors.
What Is the Most Common Valuation Multiple Mistakes to Avoid?
Based on reviewing thousands of valuations, these are the errors we see most frequently:
1. Mismatching Value Measures and Drivers: Dividing Enterprise Value by Net Income, or Equity Value by EBITDA. This produces meaningless ratios.
2. Ignoring Non-Recurring Items: Including one-time gains or losses in LTM calculations distorts the true operating picture.
3. Using Stale Comparables: Applying multiples from transactions 2+ years ago without adjusting for market condition changes.
4. Accepting Management Projections at Face Value: Not stress-testing NTM estimates against historical achievement rates and industry benchmarks.
5. Ignoring Control Premiums: Precedent transaction multiples include control premiums (typically 20-40%); trading comparables do not.
6. Wrong Timeframe for the Audience: Presenting NTM multiples to a conservative lender, or LTM multiples to a growth-focused VC.
What Best Practices Ensure Accurate Multiple Calculations?
Essential Calculation Principles
1. Maintain Metric Consistency: Always match enterprise value with pre-financing metrics and equity value with post-financing metrics
2. Normalize Historical Data: Remove non-recurring items, unusual gains/losses, and one-time events from LTM calculations
3. Validate Forward Assumptions: Cross-check NTM projections against historical achievement rates and industry benchmarks
4. Use Multiple Approaches: Triangulate valuations using DCF analysis, precedent transactions, and public market comparables
5. Document All Assumptions: Maintain detailed supporting analysis for audit review and investor scrutiny
Core Valuation Methodologies We Apply
- Market Approach: Guideline Public Company Method and Guideline Transaction Method
- Income Approach: Discounted Cash Flow analysis and Capitalization of Earnings
- Asset Approach: Adjusted Net Asset Method for asset-heavy businesses
- Option Pricing Models (OPM): For companies with complex capital structures, including preferred stock with liquidation preferences
- Backsolve Method: For businesses with recent financing rounds or arm’s-length transactions
Why Does Transaction Capital LLC Emphasize Both LTM and NTM Analysis?
Our comprehensive business valuation services integrate both historical and forward-looking perspectives to deliver maximum accuracy and defensibility.
Our Dual-Timeline Approach Includes:
- LTM analysis anchored in audited financial statements and quality of earnings reviews
- NTM projections validated through industry research and management interview processes
- Sensitivity analysis showing valuation ranges under different growth scenarios
- Peer benchmarking using both trailing and forward multiples from comparable companies
Complex Capital Structure Expertise: Our team specializes in valuing intricate ownership structures including SAFE notes, strike price determinations, complex cap table analysis, stock incentive plans, convertible securities, and sophisticated debt-equity instruments. This expertise proves invaluable for startups and growth companies with multiple classes of equity and conversion features.
This methodology ensures our clients receive valuations that satisfy regulatory requirements (including Section 409A compliance), pass Big 4 audit scrutiny, and support successful fundraising or M&A transactions.
Ready to Get Professional Valuation Analysis?
Transaction Capital LLC’s certified valuation experts provide comprehensive business valuations using both LTM and NTM analysis tailored to your specific transaction needs. Our audit-ready reports satisfy regulatory requirements while maximizing your company’s market positioning.
Contact us today for a free 15-minute consultation to discuss how our proven dual-timeline valuation approach can support your fundraising, M&A, or strategic planning objectives.
Frequently Asked Questions
1. Is LTM the same as TTM in valuation analysis?
Yes, LTM (Last Twelve Months) and TTM (Trailing Twelve Months) are identical terms used interchangeably in financial analysis and valuation work. Both refer to actual financial performance over the most recent twelve-month period.
2. Can you calculate NTM multiples without management projections?
For publicly traded companies, analyst consensus estimates from Bloomberg, FactSet, or Capital IQ provide reliable NTM data. Private companies typically require management of projections or detailed bottom-up forecasting based on industry research, historical trends, and operational analysis.
3. Which approach works better for high-growth startup valuations?
NTM multiples typically provide more accurate valuations for rapidly growing startups (50%+ annual growth) because they capture future performance scaling that LTM data cannot reflect. However, investors will scrutinize the assumptions behind your projections, so ensure they’re defensible.
4. Do institutional investors prefer LTM or NTM multiples?
Preferences vary by investor type: conservative lenders and value investors emphasize LTM data for its reliability, while growth investors, venture capital, and strategic acquirers focus primarily on NTM potential and scalability. Most sophisticated investors want to see both perspectives.
5. Should valuation multiples be adjusted for seasonal business patterns?
Absolutely. Seasonal businesses like retail, hospitality, and consumer products require careful timing adjustments to avoid distorted valuations. Using NTM projections or ensuring your LTM period captures a complete seasonal cycle helps prevent misleading conclusions.
6. How do 409A valuations typically handle LTM vs NTM selection?
For 409A valuations, the IRS generally prefers verifiable LTM data because it’s auditable and objective. However, for high-growth companies where LTM would significantly understate value, NTM projections may be appropriate if they’re reasonable and well-documented. The key is defensibility under audit scrutiny.
7. What’s the typical range of control premiums in precedent transactions?
Control premiums in M&A transactions typically range from 20-40% over the pre-announcement trading price. When using precedent transaction multiples, remember they already include this control premium, while trading comparables from public companies do not.
8. How does Transaction Capital ensure valuation accuracy?
Our ABV®, ASA, and CVA® certified professionals follow USPAP, SSVS, and NACVA standards while adhering to IRS Revenue Ruling 59-60 guidelines. We use multiple methodologies (market, income, and asset approaches) and present both LTM and NTM analyses to establish defensible valuation ranges that withstand audit scrutiny.