The Ultimate Hotel Valuation Calculator Guide: Beyond Just Real Estate (2026)

Dr. Gaurav B.
Founder & Principal Valuer, Transaction Capital LLC
Specialist in IRS-Compliant 409A & Complex Valuation Matters
Dr. Gaurav B. is the Founder and Principal Valuer of Transaction Capital LLC, a valuation and financial advisory firm providing independent, standards-based valuation opinions for startups, growth-stage companies, and established enterprises.
Introduction
A hotel valuation calculator determines your property’s worth by analyzing operational performance, revenue metrics, and market positioning – not just real estate fundamentals. Professional hotel valuations in 2026 typically range from $125,000 to over $400,000 per room, with luxury properties in prime markets exceeding $1 million per key. Understanding how hospitality assets are valued can unlock millions in hidden value or prevent costly overpayment mistakes.
Are you planning to sell, refinance, acquire, or simply understand your hotel’s true market value? The difference between a well-supported valuation and a rough estimate can represent millions of dollars and determine whether your transaction succeeds or fails.
This comprehensive guide explains why hotel valuation extends far beyond traditional real estate appraisal. You will discover the key performance indicators that drive hospitality asset values, master the four primary valuation methods recognized by RICS Red Book standards, and learn how to use a simplified hotel valuation calculator for preliminary estimates.
Transaction Capital LLC also explores why MRICS-backed valuations provide unique global credibility for transactions, financing, and regulatory compliance.
Why Does Hotel Valuation Differ from Standard Real Estate Appraisals?
Hotel valuation requires fundamentally different approaches than conventional property appraisal because hotels function as operating businesses wrapped in real estate. The property itself represents only one component of value – operational performance, brand strength, and management of quality often matter more than location and square footage alone.
Consider two identical 150-room buildings on the same city block. The first operates as a luxury Marriott achieving 78% occupancy at $325 per night with a RevPAR of $254. The second functions as an independent motel struggling at 42% occupancy and $95 per night, generating just $40 RevPAR.
Despite identical real estate, the Marriott might be worth $45 million while the motel trades at $8 million. This $37 million gap exists entirely because of operational and brand factors that traditional real estate appraisals never capture.
Hotels Operate as Businesses, Not Static Assets
Traditional commercial properties like office buildings and retail centers generate value through long-term lease agreements. Tenants sign multi-year contracts, creating predictable income streams that appraisers can capitalize with relative certainty. Hotel economics works completely differently.
Hotels rent rooms at night to thousands of different guests annually. Revenue fluctuates daily based on demand patterns, competitive pricing, seasonal factors, and economic conditions. A successful hotel requires sophisticated revenue management, skilled labor, effective marketing, and operational excellence – capabilities that vary dramatically between properties and operators.
This operational complexity demands specialized business valuation services that account for both tangible real estate assets and intangible operational capabilities. Transaction Capital LLC combines real estate credentials (MRICS) with business valuation expertise (ABV®, CVA®, ASA) to deliver comprehensive hospitality assessments.
Variable Income Streams Create Valuation Complexity
Unlike office buildings with five-year lease contracts or retail centers with percentage rent clauses, hotels face extreme income variability. Several factors contribute to this uncertainty:
1. Seasonal demand patterns create occupancy swings of 40-60% between peak and off-peak periods for many properties. A ski resort hotel might achieve 95% occupancy in January but struggle to fill 30% of rooms in July.
2. Daily rate fluctuations mean hotels constantly adjust pricing based on demand forecasts, competitive rates, and booking pace. ADR can vary 50% or more between a Tuesday night in February and a Saturday during a major convention.
3. Competitive pressure from new supply, alternative accommodations, and adjacent markets continuously impacts performance. The 2026 pipeline includes an additional 0.7-0.8% supply growth nationally, with some markets seeing significantly higher additions.
4. Economic sensitivity affects travel patterns almost immediately. Business travel responds to corporate profitability, while leisure travel correlates with consumer confidence and disposable income.
These income uncertainties require valuation approaches that project future performance scenarios and appropriate discount for risk – methodologies that generic real estate appraisers rarely master.
Ready to Discover Your Hotel’s True Market Value?
Schedule a FREE 15-minute consultation with our MRICS-certified hospitality valuation experts today.
What Makes a Hotel Valuation Calculator Reliable?
Professional hotel valuation calculators must incorporate multiple performance metrics beyond basic real estate factors. Simple price-per-square-foot calculations or generic cap rate applications produce dangerously inaccurate results for hospitality assets. Reliable calculators integrate operational performance data, market positioning analysis, and appropriate risk adjustments.
Revenue Performance Indicators
Three key metrics form the foundation of hotel revenue analysis:
1. Average Daily Rate (ADR) measures the average price charged per occupied room during a specific period. This metric reflects pricing power, market positioning, and competitive dynamics. In 2026, U.S. hotel ADR is projected to grow approximately 1.0% to around $162.65 nationally, though luxury properties command significantly higher rates.
2. Occupancy Rate indicates the percentage of available rooms filled during a measurement period. National occupancy is forecast to average approximately 61.7% in 2026, representing a slight decline of 0.5% from 2025 levels. Occupancy varies dramatically by segment, location, and property type.
3. Revenue per Available Room (RevPAR) combines ADR and occupancy into a single efficiency metric: RevPAR = ADR × Occupancy Rate. This industry gold standard measures how effectively a hotel converts its room of inventory into revenue. U.S. RevPAR is projected to reach approximately $100.43 in 2026, representing modest 0.6-0.9% growth over 2025.
Operational Efficiency Metrics
Beyond top-line revenue, operational efficiency determines how much income flows to the bottom line:
1. Net Operating Income (NOI) equals gross operating income minus operating expenses, excluding debt service, taxes, depreciation, and capital expenditures. NOI serves as the primary input for income-based valuation methods and directly drives property value.
2. EBITDA (Earnings Before Interest, Taxes, Depreciation, and Amortization) provides another profitability measure commonly used for EBITDA for multiple valuations. Typical hotel EBITDA margins range from 25-40% of total revenue, varying by segment and management efficiency.
3. Gross Operating Profit (GOP) represents revenue minus direct operating expenses, including departmental costs like labor, supplies, and energy. GOP margins typically range from 35-45% for well-operated properties.
Market Position Factors
Qualitative factors significantly impact valuation even when quantitative metrics appear similar:
1. Brand affiliation strength affects pricing power, distribution reach, and operational efficiency. Major brands (Marriott, Hilton, Hyatt, IHG) command premium valuations due to loyalty programs, global reservations systems, and standardized operations.
2. Location and demand generators determine revenue sustainability and growth potential. Properties near airports, convention centers, tourist attractions, or corporate headquarters benefit from diversified demand sources.
3. Competitive set positioning reveals whether a hotel captures its fair share of market demand. The RevPAR index (measuring performance versus competitors) indicates whether operational improvements could unlock additional value.
4. Seasonality patterns affect risk perception and cash flow predictability. Hotels with consistent year-round demand typically command lower cap rates than properties with extreme seasonal variations.
How Do Professional Hotel Valuation Methods Work?
The RICS Red Book framework recognized globally as the gold standard for property valuation classifies hotels as “trade-related properties” requiring specialized valuation approaches. Professional appraisers typically apply multiple methods and reconcile results to develop defensible value conclusions. Here are the four primary methodologies:
1. Income Capitalization Method (Cap Rate Approach)
The income capitalization method converts current income into value by applying a market-derived capitalization rate. This approach works best for stabilized properties with predictable cash flows.
Formula: Property Value = Net Operating Income ÷ Capitalization Rate
Example Calculation:
- Annual NOI: $2.8 million
- Market Cap Rate: 8.5%
- Estimated Value: $32.9 million
2026 Cap Rate Benchmarks by Segment:
Hotel Segment | Typical Cap Rate Range | Notes |
Luxury/Upper Upscale | 7.5% – 8.5% | Trophy assets trading at lower yields |
Upscale/Upper Midscale | 8.5% – 10.0% | Most active transaction segment |
Select Service | 8.5% – 9.5% | Popular with private investors |
Extended Stay | 8.0% – 9.5% | Premium for residential stability |
Economy/Budget | 9.5% – 11.0% | Higher risk requires higher returns |
Cap rates remain elevated in 2026 compared to pre-pandemic levels, with luxury hotels around 8.1% (up from 7.4% in 2019) and upscale properties averaging approximately 9.5%. Interest rate movements and capital availability will continue influencing hospitality cap rates throughout 2026.
Strengths: Simple, widely understood, directly reflects current market conditions.
Limitations: May undervalue properties with growth potential; highly sensitive to cap rate selection; assume stable income continuation.
2. Discounted Cash Flow (DCF) Analysis
The DCF method projects future cash flows over a defined period and discounts them to present value using an appropriate discount rate. This comprehensive approach captures growth expectations, capital expenditure requirements, and terminal value calculations.
Key Steps:
Step 1: Project Future Cash Flows – Develop year-by-year projections for revenue, expenses, and NOI, typically over a 5–10-year horizon. Incorporate realistic growth assumptions, operational improvements, and market trends.
Step 2: Determine Appropriate Discount Rate – Calculate the weighted average cost of capital (WACC) or apply a property-specific discount rate reflecting risk characteristics. Hotel discount rates typically range from 9-14%, depending on property quality, location, and income stability.
Step 3: Calculate Terminal Value – Estimate property value at the end of the projection period using either a terminal cap rate (NOI ÷ Terminal Cap) or perpetuity growth formula. Terminal cap rates typically exceed going-in cap rates by 50-100 basis points.
Step 4: Discount to Present Value – Apply the discount rate to each year’s cash flow and the terminal value, then sum all present values.
Best For: Full-service hotels, resorts, properties undergoing repositioning, assets with significant growth potential, and transactions where buyer-specific assumptions matter.
3. Market Comparison (Sales Approach)
The sales comparison approach analyzes recent transactions of comparable hotel properties, adjusting differences to derive value indications for the subject property.
Common Transaction Metrics:
Price Per Room (Per Key): The most widely used quick metric, calculated as Sale Price ÷ Number of Rooms. 2025 benchmarks by segment:
Property Type | Price Per Room Range | Premium Examples |
Limited Service | $50,000 – $120,000 | Brand-new builds higher |
Select Service | $100,000 – $200,000 | Gateway markets premium |
Full Service | $175,000 – $350,000 | Convention hotels higher |
Luxury/Resort | $300,000 – $600,000+ | Trophy assets $1M+ per key |
Extended Stay | $80,000 – $180,000 | Urban locations premium |
EBITDA Multiples: Transaction values expressed as multiples of trailing or projected EBITDA. Typical ranges:
- Economy/Budget: 5x – 7x EBITDA
- Select Service: 7x – 9x EBITDA
- Full Service: 8x – 11x EBITDA
- Luxury/Resort: 10x – 14x EBITDA
RevPAR Multiples: Some markets express value as a multiple of annual RevPAR per key, typically ranging from $25,000 to $60,000 times RevPAR depending on market and segment.
Adjustments Required: Professional appraisers adjust comparable sales for differences in location, size, brand, physical condition, recent renovations, transaction date, and market conditions.
4. Cost Replacement Method
The cost approach estimates the value of constructing a similar property today, minus accumulated depreciation and obsolescence. This method establishes a theoretical ceiling value by answering: “What would it cost to build this hotel from scratch?”
Components:
- Land Value: Market value of the underlying real estate
- Hard Costs: Construction labor and materials
- Soft Costs: Architectural, engineering, permits, financing costs
- FF&E: Furniture, fixtures, and equipment
- Pre-Opening Expenses: Training, marketing, initial staffing
- Less Depreciation: Physical deterioration, functional obsolescence, economic obsolescence
Development Cost Benchmarks (Per Room):
Hotel Type | Median Cost/Room | High-End Range |
Limited Service | $167,000 | $200,000+ |
Extended Stay (Midscale) | $169,000 | $220,000+ |
Extended Stay (Upscale) | $265,000 | $320,000+ |
Select Service | $223,000 | $280,000+ |
Full Service | $409,000 | $550,000+ |
Luxury | $1,057,000 | $2,000,000+ |
Best For: Newly constructed properties, unique assets with limited comparables, feasibility analysis, and insurance purposes.
Reconciling Multiple Methods
Professional appraisers typically apply multiple methods and weight results based on data quality, property characteristics, and intended use. For example:
- Stabilized Full-Service Hotel: 60% income approach, 30% sales comparison, 10% cost approach
- Newly Built Select-Service: 40% income approach, 30% sales comparison, 30% cost approach
- Distressed Property with Turnaround Potential: 70% DCF approach, 20% sales comparison, 10% cost approach
Get Your MRICS-certified Hotel Valuation in Just 2-5 Business Days.
Transaction Capital LLC delivers audit-ready hotel valuation reports starting at $500. Get expert insights from certified professionals and make confident investment or financing decisions.
Contact Our Valuation ExpertsHotel Valuation Calculator: Step-by-Step Process
While professional valuations require detailed financial modeling, market research, and expert judgment, simplified calculators can provide preliminary estimates for initial planning purposes. Here’s how to develop quick hotel value estimates using multiple approaches:
1. Quick Valuation Rules of Thumb
Method 1: ADR Multiplier (Room-Rate Rule)
This widely used shortcut multiplies the Average Daily Rate by 1,000, then by the number of rooms:
Formula: Value = ADR × 1,000 × Number of Rooms
Example: A 120-room hotel with $165 ADR
- Value = $165 × 1,000 × 120 = $19,800,000
Limitations: Ignores occupancy, expenses, non-room revenue, and market conditions. Use only as a rough starting point.
Method 2: RevPAR Multiple
Multiplies RevPAR by a market-appropriate factor and room count:
Formula: Value = RevPAR × Multiple × Number of Rooms
Typical multiples range from $30,000 to $50,000 depending on market quality.
Example: A 100-room hotel with $125 RevPAR in a strong market
- Value = $125 × $40,000 × 100 = $50,000,000 (expressed as $500/RevPAR or simply RevPAR × 40K)
Method 3: Price Per Room Benchmark
Compare to recent transactions of similar properties:
Formula: Value = Comparable Price Per Room × Number of Rooms
Example: A 150-room select-service hotel in a market where comparable properties trade at $145,000 per key
- Value = $145,000 × 150 = $21,750,000
2. Detailed Income Approach Calculator
For more sophisticated estimates, work through this income capitalization process:
Required Inputs:
- Annual gross revenue (rooms + F&B + other)
- Operating expense ratio (typically 60-75% of revenue)
- Appropriate capitalization rate (7.5-11% for hotels)
Calculation Steps:
Step 1: Calculate Net Operating Income NOI = Gross Revenue × (1 – Operating Expense Ratio)
Step 2: Apply Capitalization Rate Value = NOI ÷ Cap Rate
Worked Example:
Property Details:
- Total Rooms: 180
- Average Daily Rate: $175
- Occupancy Rate: 68%
- RevPAR: $119 ($175 × 68%)
- Annual Room Revenue: $7,820,700 (180 rooms × 365 days × $119)
- Total Revenue (including F&B): $9,775,875 (rooms = 80% of total)
- Operating Expense Ratio: 68%
- NOI: $3,128,280 ($9,775,875 × 32%)
- Market Cap Rate: 8.75%
Calculated Value: $35,751,771 Per Room Value: $198,621
Disclaimer: These calculator approaches provide preliminary estimates only. Professional valuations require comprehensive market analysis, detailed financial review, physical inspection, and appropriate regulatory compliance. Transaction Capital LLC recommends using calculators for initial planning while engaging credentialed professionals for transaction, financing, or tax-related valuations.
What Key Factors Drive Hotel Property Values?
Understanding value drivers help property owners maximize asset worth; investors evaluate acquisition opportunities, and lenders assess collateral risk. Here are the critical factors influencing hotel valuations in 2026:
1. Occupancy Rate and Average Daily Rate Performance
These two metrics combine to create RevPAR but analyzing them separately reveals important insights about pricing power versus demand capture.
Occupancy Rate indicates how effectively a hotel fills its room in inventory. High occupancy suggests strong demand, effective distribution, and competitive positioning. However, occupancy above 80-85% may indicate pricing opportunity—the hotel could potentially raise rates without significant demand loss.
Average Daily Rate reflects pricing of power and market positioning. Hotels commanding premium ADRs relative to competitors typically possess superior location, brand strength, physical quality, or service reputation. ADR growth above inflation signals real pricing power and supports higher valuations.
RevPAR Analysis: Consider two 100-room hotels generating identical $150 RevPAR:
- Hotel A: $200 ADR × 75% occupancy = $150 RevPAR
- Hotel B: $175 ADR × 86% occupancy = $150 RevPAR
Despite identical RevPAR, Hotel A likely commands a higher valuation. Its stronger pricing power and occupancy runway (room improvement from 75% to 80%+) suggests greater upside potential than Hotel B, which is already near capacity constraints.
2. RevPAR – The Core Performance Benchmark
RevPAR serves as the hospitality industry’s most important performance metric because it simultaneously captures pricing and demand dynamics. In our experience working with 2,500+ valuation clients, RevPAR trends and competitive positioning consistently prove more predictive of value than any single factor.
RevPAR Index (Market Share): Comparing property RevPAR against the competitive set reveals relative performance:
- RevPAR Index > 100: Capturing more than fair share
- RevPAR Index = 100: Performing at market parity
- RevPAR Index < 100: Underperforming the competitive set
Hotels with RevPAR Index below 90 often present value-add opportunities if operational improvements can close the gap. Conversely, properties consistently above 110 index demonstrate sustainable competitive advantages warranting premium valuations.
3. Location and Demand Generators
Strategic positioning near demand generators creates stable revenue streams and reduces investment risk. Key demand generators include:
Transportation Hubs: Airports, train stations, cruise terminals, and highway interchanges generate consistent transient demand. Airport hotels benefit from schedule-driven travel that’s relatively insensitive to economic cycles.
Corporate Demand Centers: Proximity to corporate headquarters, business parks, industrial facilities, and government offices supports weekday occupancy and corporate rate business.
Leisure Attractions: Hotels near theme parks, beaches, historic districts, national parks, and entertainment venues capture visitor spending. The 2026 FIFA World Cup will significantly boost hotel demand in host cities (New York, Los Angeles, Miami, Dallas, Atlanta, and others), with forecasts suggesting a 0.4% national RevPAR lift.
Meeting Facilities: Convention centers, conference venues, and universities generate group business that fills hotels during otherwise soft periods.
Medical Complexes: Hospitals, medical schools, and research facilities create steady demand from patients, visitors, and healthcare professionals.
4. Brand Affiliation and Management Quality
Brand affiliation influences value through multiple channels:
Revenue Enhancement:
- Loyalty program members (Marriott Bonvoy, Hilton Honors, IHG Rewards) often pay premium rates
- Global distribution systems and brand.com channels reduce acquisition costs
- Brand standards maintain physical and service quality
Cost Implications:
- Franchise fees typically range 4-6% of room revenue
- Brand-mandated PIPs (property improvement plans) require capital investment
- Royalty and marketing contributions add to operating expenses
Valuation Impact:
Affiliation Type | Typical Value Premium | Key Considerations |
Major Brand (Marriott, Hilton, Hyatt) | 10-20% over independent | Loyalty program strength, distribution reach |
Soft Brand (Autograph, Curio, Tribute) | 5-15% premium | Brand benefits with design flexibility |
Independent/Boutique | Varies widely | Requires strong local reputation |
Independent hotels can achieve comparable or superior values if they have developed strong local brands, efficient direct booking channels, and operational excellence. Our ABV® and ASA certified appraisers carefully analyze brand economics when developing valuation conclusions.
5. Seasonality and Revenue Predictability
Revenue predictability directly influences risk perception and appropriate cap rates:
High Seasonality Properties (ski resorts, beach hotels, summer destinations):
- Experience 40-60% revenue fluctuations between peak and off-peak
- Require more conservative DCF assumptions and higher discount rates
- May justify higher cap rates (lower values) due to cash flow volatility
- Benefit from demonstrated ability to manage off-season revenue
Stable Occupancy Properties (airport hotels, interstate lodging, urban business hotels):
- Maintain more consistent year-round performance
- Support lower cap rates due to predictable cash flows
- Appeal to risk-averse investors and lenders
- Often achieve premium valuations relative to seasonal competitors
From our practice, we’ve observed that hotels demonstrating creative off-season strategies—corporate retreats, wedding packages, special events—often achieve meaningful valuation premiums over comparably-positioned seasonal properties.
6. Net Operating Income and Margin Efficiency
NOI represents the most direct value driver across all income-based methodologies. A $100,000 NOI improvement, capitalized at 9%, adds $1.1 million to property value.
NOI Optimization Strategies:
Revenue Enhancement:
- Implement revenue management systems for dynamic pricing
- Optimize distribution channel mix (reduce OTA dependence)
- Develop ancillary revenue streams (parking, F&B, events, spa)
- Enhance guest experience to support premium positioning
Expense Management:
- Energy efficiency improvements (LED lighting, smart thermostats, efficient HVAC)
- Labor scheduling optimization using demand forecasting
- Technology automation (mobile check-in, chatbots, automated revenue management)
- Vendor contract renegotiation and procurement optimization
Margin Benchmarks by Segment:
Segment | Typical GOP Margin | NOI Margin |
Luxury/Full-Service | 35-42% | 25-32% |
Select Service | 45-52% | 32-40% |
Extended Stay | 50-58% | 38-45% |
Economy | 40-48% | 28-35% |
Properties operating below segment benchmarks often present value-add opportunities through operational improvements.
How Does the 2026 Hotel Market Impact Valuations?
Current market conditions significantly influence hotel valuations through cap rate trends, transaction activity, and performance expectations. Understanding the 2026 outlook helps buyers, sellers, and owners make informed decisions.
2026 RevPAR and Performance Outlook
Industry forecasters project modest RevPAR growth in 2026, though market bifurcation will create winners and losers:
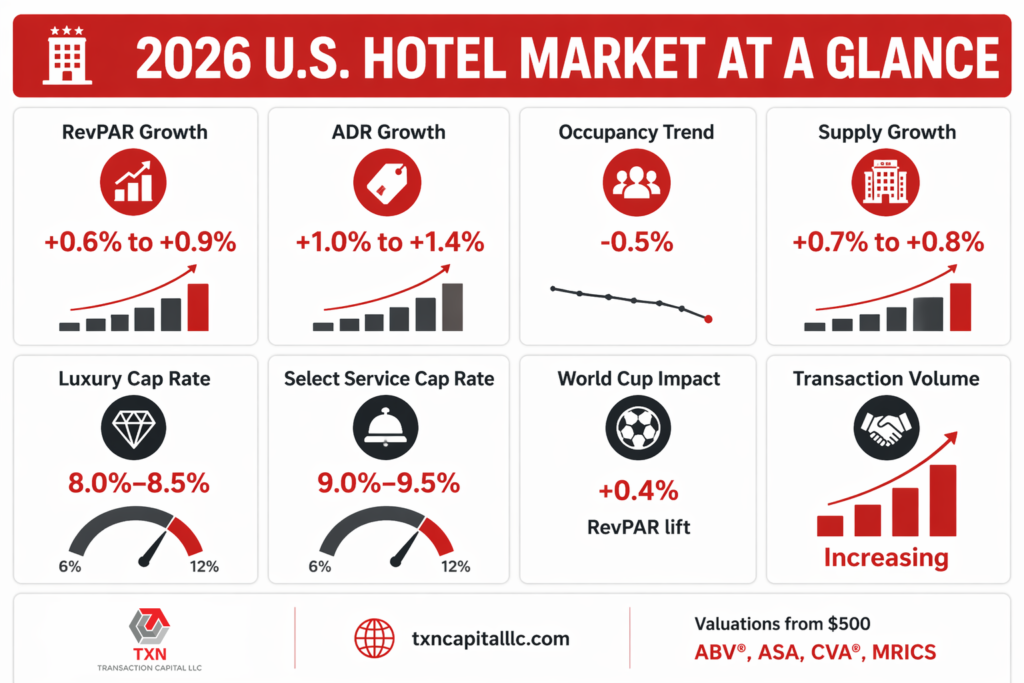
National Projections:
- RevPAR Growth: +0.6% to +0.9% (STR/CoStar, PwC, LARC forecasts)
- ADR Growth: +1.0% to +1.4%
- Occupancy: -0.5% (slight decline from 2025)
- Supply Growth: +0.7% to +0.8%
Key Market Dynamics:
FIFA World Cup Boost: The 2026 World Cup, hosted across 10 major U.S. markets, is forecast to add approximately 0.4% to national RevPAR. Host cities (New York, Los Angeles, Miami, Dallas, Atlanta, Houston, Philadelphia, Seattle, Kansas City, and San Francisco Bay Area) will see concentrated benefits.
Luxury Outperformance: Consumer bifurcation continues favoring upper-tier properties. Luxury and upper-upscale segments will likely outperform middle and economy tiers, consistent with trends observed since 2024.
Cost Pressures: Operating expenses, particularly labor and insurance, continue rising faster than revenue growth, pressuring margins. EBITDA is projected to decline 1.1% nationally despite modest RevPAR gains.
Cap Rate and Transaction Outlook
After elevated cap rates through 2024-2025, the transaction market shows signs of stabilization:
Cap Rate Expectations:
- Luxury: 8.0-8.5% (stable to slightly improving)
- Upscale: 9.0-10.0% (may peak in 2026)
- Select Service: 9.0-9.5% (stable)
- Economy: 10.0-11.0% (stable to widening)
Transaction Volume: Forecasters expect increased hotel transaction activity in 2026 as interest rate clarity improves and bid-ask spreads narrowly. JLL and other brokers report significant capital waiting for deployment opportunities.
Value Outlook: LARC forecasts U.S. hotel values may decline an additional 3% in 2026 due to margin compression, though five-year cumulative value growth of 2% is expected. Properties in World Cup host markets and high-growth Sun Belt locations may outperform national averages.
Why Choose RICS Red Book Compliant Hotel Valuations?
The RICS (Royal Institution of Chartered Surveyors) Red Book Global Standards represent the international gold standard for property valuation, providing unmatched credibility and global acceptance for hospitality assets.
Global Recognition and Acceptance
RICS Red Book compliant valuations are recognized and accepted by:
- International banks and lending institutions across 140+ countries
- Regulatory authorities including the SEC, European Central Bank, and national supervisors
- Big Four accounting firms (Deloitte, PwC, EY, KPMG) for audit and financial reporting
- Courts and legal systems for litigation and dispute resolution
- Institutional investors, sovereign wealth funds, and pension funds
- Private equity firms and real estate investment trusts (REITs)
Mandatory Professional Requirements
RICS Red Book valuations must satisfy strict professional standards:
- Independence: Valuers must maintain complete objectivity and avoid actual or perceived conflicts of interest. This independence ensures valuations serve client interests rather than transaction agendas.
- Transparency: All assumptions, methodologies, limiting conditions, and special factors must be clearly documented. Users can understand exactly how the value reached conclusions.
- Consistency: Standardized approaches ensure valuations prepared in New York are comparable to those prepared in London, Hong Kong, or Dubai. This international consistency is essential for cross-border transactions.
- Defensibility: Reports are structured to withstand scrutiny from auditors, regulators, courts, and opposing experts. Every conclusion is supported by market evidence and professional reasoning.
Trade-Related Property Expertise
The RICS Red Book provides specific guidance for hotels and other trade-related properties:
- Recognition that trading potential determines value, not just real estate characteristics
- Requirements for proper treatment of goodwill, management agreements, and operational factors
- Standards for projecting cash flows and selecting appropriate capitalization rates
- Guidance on handling franchise agreements, management contracts, and brand relationships
- Protocols for inspecting property condition and assessing capital expenditure requirements
When Should Hotels Be Revalued?
Regular revaluation ensures accurate financial reporting, optimal financing, and informed strategic decision-making. Different purposes require different revaluation of frequencies.
Recommended Revaluation Timing
Annual Revaluations: Required or recommended for:
- Publicly traded companies (GAAP/IFRS requirements)
- Properties securing institutional debt
- Assets held by pension funds or insurance companies
- Properties subject to management incentive calculations
Biennial or Event-Driven Revaluations: Appropriate for:
- Privately held assets with stable operations
- Properties with fixed-rate financing
- Family-owned hotels without near-term transaction plans
Events Triggering Revaluation
Physical Changes:
- Major renovations exceeding $5,000 per room
- Brand conversions or flag changes
- Addition of meeting facilities, restaurants, or amenities
- Significant deferred maintenance or capital needs
Operational Changes:
- Management company transitions
- Significant performance improvement or decline (15%+ RevPAR change)
- New franchise agreements or contract renegotiations
- Major staffing or operational restructuring
Market Changes:
- New competitive supply entering the market
- Significant demand generator changes (corporate relocation, convention center closure)
- Material interest rate movements
- Economic shifts affecting travel patterns
Transaction/Financing Events:
- Contemplated sale or acquisition
- Refinancing or loan modification
- Partnership restructuring or buyout
- Estate planning or gift transfers
How Is Our Hotel Valuation Process Structured?
Transaction Capital LLC’s comprehensive approach ensures accurate, defensible valuations that meet regulatory requirements and support informed decision-making.
Phase 1: Engagement and Data Collection
Initial Consultation: Understanding purpose, intended users, and specific requirements. Different uses (financing, tax, litigation, transaction) may require different approaches and compliance standards.
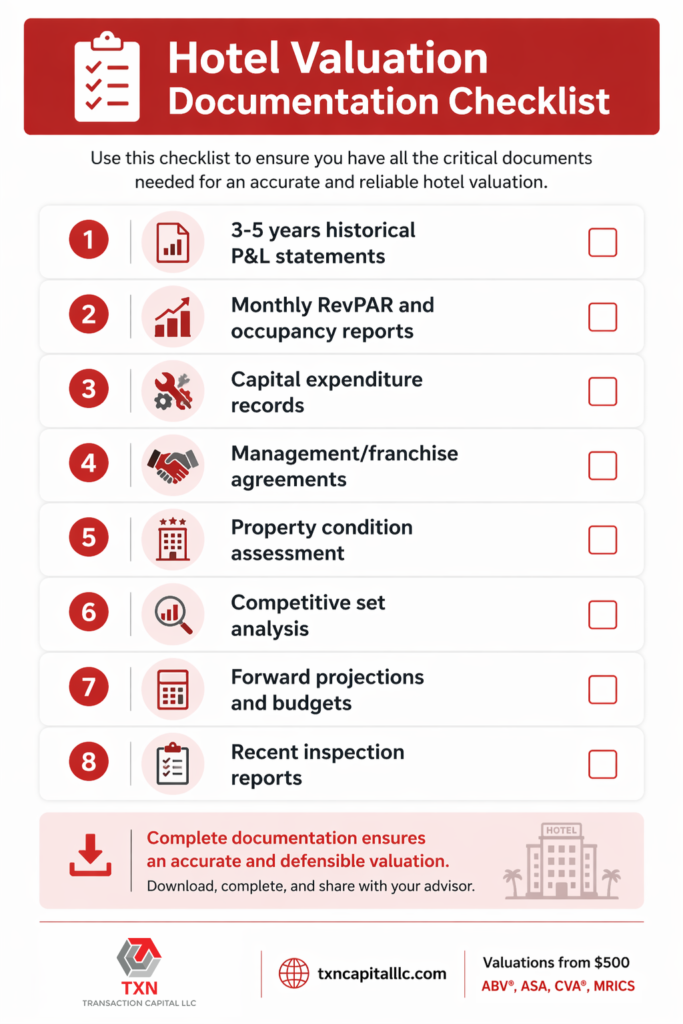
Document Collection:
- Historical operating statements (3-5 years preferred)
- Monthly performance reports showing ADR, occupancy, and RevPAR
- Capital expenditure records and planned improvements
- Management and franchise agreements
- Recent property condition assessments
- Competitive set and market data
Property Inspection: Physical assessment of condition, maintenance quality, FF&E status, and capital needs. Inspection also evaluates market positioning, demand generators, and competitive dynamics.
Phase 2: Market Research and Analysis
- Competitive Analysis: Identification of competitive sets, analysis of market share trends, and assessment of new supply pipelines.
- Transaction Research: Analysis of recent comparable sales, adjustments for property differences, and derivation of applicable benchmarks.
- Economic Analysis: Review of local economic conditions, employment trends, demand generator stability, and growth outlook.
Phase 3: Financial Analysis and Valuation
Financial Review: Detailed analysis of revenue trends, expense ratios, capital requirements, and NOI calculations. Normalization for one-time items and adjustments to reflect market-level performance.
Method Application:
- Income approach (direct capitalization and/or DCF)
- Sales comparison with appropriate adjustments
- Cost approach when applicable
- Sensitivity analysis on key assumptions
Reconciliation: Weighting of method results based on data quality, reliability, and applicability to develop final value conclusions.
Phase 4: Report Preparation and Delivery
Report Components:
- Executive summary with key conclusions
- Property description and inspection findings
- Market analysis and competitive positioning
- Detailed methodology explanation
- Supporting financial analysis
- Assumptions and limiting conditions
- Professional certifications
Quality Review: Internal peer review ensuring accuracy, consistency, and compliance with applicable standards.
Delivery and Support: Final report delivery with executive briefing, followed by ongoing support for questions, audit inquiries, or transaction discussions.
What Are Special Purpose Hotel Valuations?
Beyond standard transaction and financing valuations, hospitality assets require specialized approaches for various compliance, tax, and legal purposes.
1. Hotel Valuations for Tax Purposes
Gift and Estate Tax Valuations: With the 2026 TCJA sunset reducing estate tax exemptions from approximately $13.6 million to $7 million, high-net-worth hotel owners face increased transfer tax exposure. Proper valuation supports:
- Minority interest discounts (typically 15-35%)
- Lack of marketability discounts (typically 20-40%)
- Fractional interest valuations
- Family limited partnership planning
Charitable Contribution Valuations: Donations of hotel interests require USPAP-compliant qualified appraisals by credentialed professionals (ASA, ABV®) to support tax deductions.
Retrospective Valuations: Tax disputes may require valuations as of historical data, demanding specialized research into market conditions at the valuation date.
2. Hotel Valuations for Litigation
Divorce and Marital Dissolution: Business valuation professionals assess hotel enterprise value and may distinguish between:
- Marital vs. separate property components
- Active appreciation attributable to spouse contributions
- Goodwill allocation (personal vs. enterprise)
Shareholder Disputes: Partnership dissolutions, minority oppression claims, and buyout disputes require defensible fair value determinations.
Condemnation and Eminent Domain: Property takings require appraisals demonstrating just compensation for hotel operations, not just real estate.
3. Hotel Valuations for Immigration Purposes
E-2 Treaty Investor Visas: Foreign nationals investing in U.S. hotels require valuations demonstrating:
- Investment substantiality relative to enterprise value
- Business viability and non-marginality
- Job creation capacity
Transaction Capital LLC’s valuations are specifically structured for USCIS adjudication standards.
4. Hotel Valuations for Lending and SBA Loans
SBA 7(a) Loan Valuations: Hotels seeking SBA financing require independent appraisals meeting specific lenders and SBA requirements. Our MRICS-backed valuations satisfy these standards.
Portfolio Valuations: Private equity firms and institutional investors require consistent valuation methodologies across multiple properties for portfolio management and investor reporting.
Real-World Hotel Valuation Examples
Understanding valuation principles in practice helps property owners, investors, and lenders make informed decisions.
Case Study 1: Urban Select-Service Hotel
Property Profile:
- 185-room select-service hotel in major Texas market
- Marriott Courtyard branding with franchise agreement through 2031
- Located near medical center complex and university
- Recently renovated (2023) with FF&E replacement
Financial Performance:
- Average Daily Rate: $142
- Occupancy Rate: 74%
- RevPAR: $105
- Total Revenue: $8.2 million annually
- Operating Expense Ratio: 67%
- NOI: $2.7 million
Valuation Analysis:
Method | Value Conclusion | Per Room |
Income Approach (9.0% cap) | $30,000,000 | $162,162 |
Sales Comparison | $31,450,000 | $170,000 |
Cost Approach | $33,300,000 | $180,000 |
Reconciled Value | $30,750,000 | $166,216 |
Valuation Notes: Income approach received primary weighting (60%) given stable operations and reliable NOI. Sales comparison (30%) confirmed market support. Cost approach (10%) served as reasonableness check—replacement cost exceeds market value due to current supply dynamics.
Case Study 2: Luxury Beach Resort
Property Profile:
- 225-room oceanfront resort in Florida
- Independent luxury property with strong local brand recognition
- Extensive amenities including spa, multiple restaurants, beach club
- Significant seasonality (winter peak)
Financial Performance:
- Average Daily Rate: $425
- Occupancy Rate: 62%
- RevPAR: $264
- Total Revenue: $28.5 million annually
- Operating Expense Ratio: 62%
- NOI: $10.8 million
Valuation Analysis:
Method | Value Conclusion | Per Room |
Income Approach (DCF, 10% discount) | $118,500,000 | $526,667 |
Income Approach (8.25% cap) | $130,900,000 | $581,778 |
Sales Comparison | $123,750,000 | $550,000 |
Reconciled Value | $124,000,000 | $551,111 |
Valuation Notes: The DCF approach received primary weighting (50%) to capture seasonal cash flow patterns and growth potential. Cap rate approach (25%) and sales comparison (25%) provided support. Premium valuation reflects irreplaceable oceanfront location and strong brand reputation.
Case Study 3: Extended-Stay Property
Property Profile:
- 120-unit extended-stay hotel in suburban Denver market
- Residence Inn by Marriott branding
- Strong corporate relocations and project-based demand
- Consistent 80%+ occupancy with minimal seasonality
Financial Performance:
- Average Daily Rate: $165
- Occupancy Rate: 81%
- RevPAR: $134
- Total Revenue: $6.4 million annually
- Operating Expense Ratio: 58%
- NOI: $2.7 million
Valuation Analysis:
Method | Value Conclusion | Per Unit |
Income Approach (8.5% cap) | $31,765,000 | $264,706 |
Sales Comparison | $30,600,000 | $255,000 |
Reconciled Value | $31,200,000 | $260,000 |
Valuation Notes: Extended-stay properties command premium valuations due to lower operating costs, higher guest retention, and residential-like stability. Strong occupancy and diverse corporate demand base support below-segment-average cap rate.
Why Choose Transaction Capital LLC for Hotel Valuations?
Our unique combination of credentials, hospitality expertise, and client-focused approach makes Transaction Capital LLC the preferred choice for hotel and hospitality valuations.
Unmatched Credential Portfolio
We are one of the few firms combining MRICS (Member of the Royal Institution of Chartered Surveyors), ABV® (Accredited in Business Valuation), ASA (Accredited Senior Appraiser), and CVA® (Certified Valuation Analyst) credentials. This comprehensive certification ensures our valuations meet international standards and regulatory requirements across all jurisdictions and purposes.
Proven Hospitality Track Record
- 2,500+ completed valuations across 35+ industries, with deep hospitality sector expertise
- 15+ years of investment banking and venture capital experience
- 100% audit defensibility record with Big Four accounting firms
- Experience with all property types: luxury resorts, select-service, extended-stay, boutique, and economy
Comprehensive Service Offering
Beyond hotel valuations, we provide integrated services that support your hospitality investments:
- Real Estate Valuation Services for mixed-use and hospitality developments
- Business Valuation Services for hospitality management companies
- Intangible Asset Valuation for brand names, franchise agreements, and management contracts
- Fairness Opinions for hotel transactions and mergers
- ESOP Valuation Services for employee ownership transitions
- Gift & Estate Tax Valuation for wealth transfer planning
Client-Focused Approach
Our valuations simultaneously comply with:
- FREE 15-minute consultation to understand your needs and recommend appropriate solutions
- Rapid turnaround times: 2-5 business days for standard reports, rush services available
- Competitive pricing: Starting at $500, with most hotel appraisals $5,000-$15,000
- Post-valuation support: Audit defense and transaction support at no additional cost
- Direct access: Work directly with credentialed professionals, not junior staff
Multi-Standard Compliance
- RICS Red Book Global Standards (international acceptance)
- USPAP Standards (U.S. regulatory compliance)
- International Valuation Standards (IVS) (global consistency)
- AICPA Business Valuation Standards (financial reporting)
This comprehensive compliance ensures acceptance by lenders, investors, auditors, tax authorities, and courts worldwide.
Get Your Professional Hotel Valuation Today
Transaction Capital LLC combines unmatched credentials (MRICS, ABV®, ASA®, CVA®) with 15+ years of hospitality expertise to deliver globally recognized, audit-defensible valuations. Our reports satisfy lenders, investors, auditors, regulators, and courts worldwide.
Whether you are buying, selling, refinancing, planning estate transfers, or simply understanding your asset’s true worth, don’t rely on basic calculators or outdated estimates when making million-dollar decisions.
Schedule Your FREE 15-Minute Consultation to discuss your hotel valuation needs with our credentialed professionals.
Frequently Asked Questions About Hotel Valuation
1. How accurate are online hotel valuation calculators compared to professional appraisals?
Online calculators provide rough estimates that typically vary 15-25% from professional appraisals. They cannot account for property-specific factors like condition, brand strength, or competitive dynamics. Professional valuations deliver defensible, audit-ready results required for financing, tax compliance, and transactions.
2. What is the typical cost for professional hotel valuations?
Hotel valuation costs range from $2,500-$7,500 for desktop valuations, $5,000-$15,000 for full appraisals, and $15,000-$50,000+ for litigation support. Transaction Capital LLC offers competitive pricing starting at $500, with most hotel appraisals ranging from $5,000-$15,000.
3. How long does a professional hotel valuation take?
Standard hotel valuations take 5-10 business days, with desktop valuations completed in 3-5 days and complex properties requiring 10-15 days. Transaction Capital LLC typically delivers reports within 2-5 business days, with rush services available for urgent needs.
4. What financial documentation is required for accurate hotel valuations?
Essential documents include 3-5 years of P&L statements, monthly RevPAR and occupancy reports, management/franchise agreements, capital expenditure records, and property condition assessments. Forward projections and competitive set data also improve valuation accuracy.
5. Can hotel valuations be used for IRS tax purposes?
Yes, appraisers must hold appropriate credentials (ABV®, ASA®) and comply with USPAP standards. Transaction Capital LLC’s credentialed team ensures IRS compliance for gift/estate tax, charitable contributions, and other tax-related hotel valuations with full audit support included.
6. What cap rate should I use for hotel valuations in 2026?
Cap rates vary by segment: luxury hotels range 7.5-8.5%, upscale 8.5-9.5%, select-service 8.5-10.0%, and economy 9.5-11.0%. Professional appraisers derive appropriate rates from market transaction analysis rather than applying generic benchmarks.
7. How do management and franchise agreements affect hotel value?
Franchise fees (4-6% of room revenue) and management fees (2-4% plus incentives) reduce NOI and impact value. Below-market agreements add value while above-market contracts reduce it. Contract terms, termination clauses, and required capital investments (PIPs) also affect valuation.
8. What is the difference between cap rate and DCF valuation methods?
The cap rate method divides current NOI by a market-derived rate for a quick value estimate—best for stabilized properties. DCF projects future cash flows over 5-10 years and discounts to present value—better for properties with growth potential or irregular income patterns.